Hadoop伪分布式集群安装配置
本文共 3431 字,大约阅读时间需要 11 分钟。
计算机开发环境:腾讯云云服务器 CentOS 7.6 64位 root用户
基础环境准备:
- Hadoop由JAVA开发,安装配置Hadoop之前需要安装配置JDK,可参考。
- Hadoop监听某些端口,需要将这些端口开放,此处直接关闭防火墙,可参考
- 配置ssh免密登录,可参考
Hadoop下载
访问下载或者键入wget命令下载
wget http://mirror.bit.edu.cn/apache/hadoop/common/hadoop-3.2.1/hadoop-3.2.1.tar.gz
Hadoop解压
键入解压命令,路径自定义
tar -zxf hadoop-3.2.1.tar.gz -C ../software
查看目录检验解压文件

配置环境变量
此处直接配置在root用户下
打开root用户根目录下的隐藏文件.bashrc
vim /root/.bashrc
在.bashrc中输入以下设定配置环境变量
# Hadoopexport HADOOP_HOME=/root/software/hadoop-3.2.1 #路径与自定义路径一致export PATH=$HADOOP_HOME/bin:$PATH
使得.bashrc文件修改生效
source /root/.bashrc
查看Hadoop版本
hadoop version
出现类似如下信息表示配置成功

Hadoop运行文件配置
共有五个配置文件需要相关信息设定以支持Hadoop运行
配置文件位于/root/software/hadoop-3.2.1/etc/hadoop,Hadoop根目录下的ect/hadoop 配置文件一:hadoop-env.sh
配置 hadoop 运行时依赖的 java 环境
将JDK路径添加至该文件,与先前JDK环境配置保持一致,随后保存退出# JDKexport JAVA_HOME=/root/software/jdk-14.0.2 #路径与自定义路径一致
配置文件二:core-site.xml
配置 hadoop 运行过程中临时文件存放的路径及 hdfs 通信方式
将以下代码进行相关修改后粘贴至该文件,随后保存退出fs.defaultFS hdfs://sunshine:9000 hadoop.tmp.dir /root/software/hadoop-3.2.1/tmp
配置文件三:hdfs-site.xml
配置 hdfs 运行时存放的 name 空间元数据和 data 数据块路径
将以下代码进行相关修改后粘贴至该文件,随后保存退出dfs.name.dir /root/software/hadoop-3.2.1/tmp/dfs/name dfs.data.dir /root/software/hadoop-3.2.1/tmp/dfs/data dfs.replication 1
配置文件四:yarn-site.xml
配置 yarn 资源管理相关信息
将以下代码进行相关修改后粘贴至该文件,随后保存退出yarn.resourcemanager.hostname sunshine yarn.nodemanager.aux-services mapreduce_shuffle yarn.nodemanager.vmem-check-enabled false yarn.nodemanager.vmem-pmem-ratio 5
配置文件五:mapred-site.xml
配置 mapreduce 相关所需资源
将以下代码进行相关修改后粘贴至该文件,随后保存退出mapreduce.framework.name yarn yarn.app.mapreduce.am.env HADOOP_MAPRED_HOME=$HADOOP_HOME mapreduce.map.env HADOOP_MAPRED_HOME=$HADOOP_HOME mapreduce.reduce.env HADOOP_MAPRED_HOME=$HADOOP_HOME mapreduce.map.memory.mb 1024
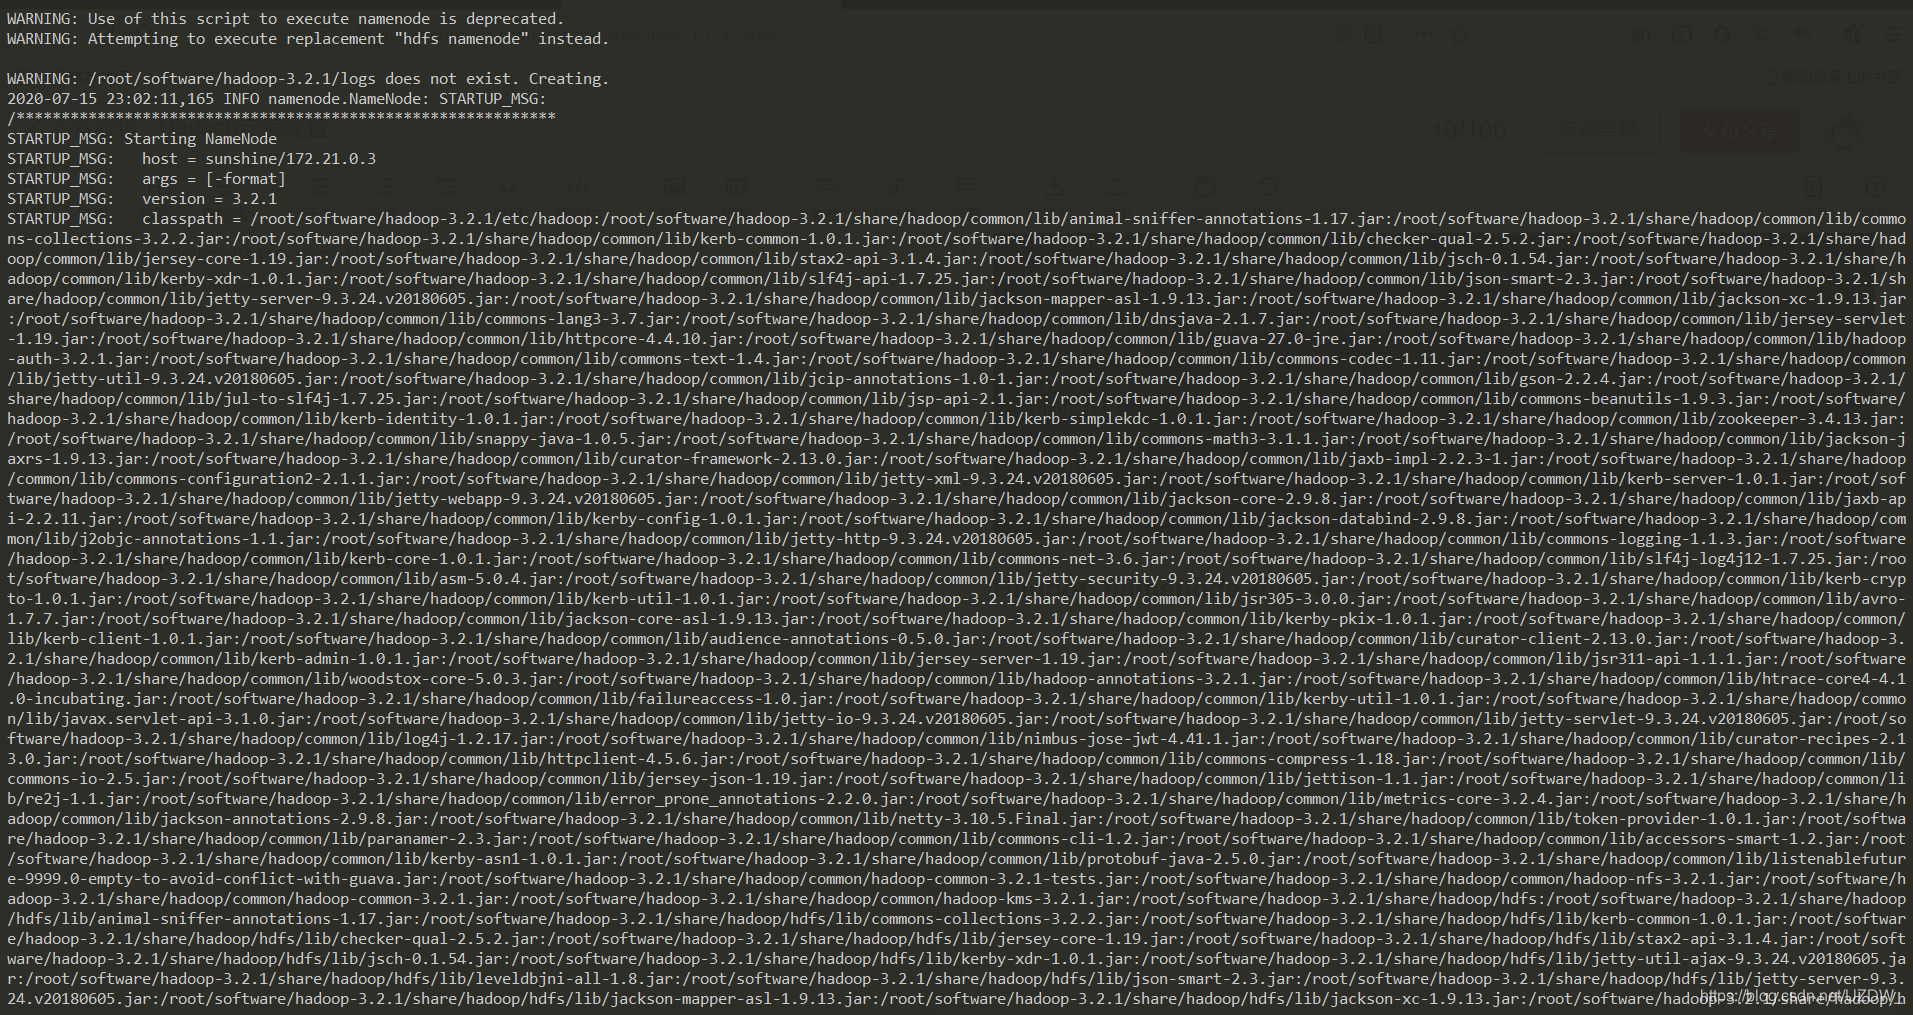
Hadoop namenode 初始化
键入初始化命令
hadoop namenode -format
出现如下实例表明namenode初始化成功


启动Hadoop
Hadoop主要的五个进程:namenode、datanode、secondarynamenode、resourcemanager、nodemanager,其中namenode、datanode、secondarynamenode由hdfs提供,resourcemanager、nodemanager由yarn提供。
在目录/root/software/hadoop-3.2.1/sbin下,包含了各个进程的启动和关闭文件  start-all.sh和stop-all.sh分别可以启动全部进程和结束全部进程,键入命令启动全部进程
 ./start-all.sh
随后华丽报错如下
 报错说明没问题,如果在root用户下安装配置Hadoop会出现上述问题,需要额外配置操作,非root用户不需要,操作如下,详细可参考。
 在目录/root/software/hadoop-3.2.1/sbin下
start-dfs.sh和stop-dfs.sh文件,文件顶部粘贴加入以下配置信息 #!/usr/bin/env bashHDFS_DATANODE_USER=rootHADOOP_SECURE_DN_USER=hdfsHDFS_NAMENODE_USER=rootHDFS_SECONDARYNAMENODE_USER=root
对于start-yarn.sh和stop-yarn.sh文件,文件顶部粘贴加入以下配置信息
#!/usr/bin/env bashYARN_RESOURCEMANAGER_USER=rootHADOOP_SECURE_DN_USER=yarnYARN_NODEMANAGER_USER=root
随后重新启动
./start-all.sh
Web端查看
链接如下,ip更改为Hadoop部署机器ip,端口默认9870。
http://119.75.217.110:9870/dfshealth.html#tab-overview

转载地址:http://oehu.baihongyu.com/
你可能感兴趣的文章
node, nvm, npm,pnpm,以前简单的前端环境为什么越来越复杂
查看>>
Node-RED中Button按钮组件和TextInput文字输入组件的使用
查看>>
vue3+Ts 项目打包时报错 ‘reactive‘is declared but its value is never read.及解决方法
查看>>
Node-RED中Switch开关和Dropdown选择组件的使用
查看>>
Node-RED中使用exec节点实现调用外部exe程序
查看>>
Node-RED中使用html节点爬取HTML网页资料之爬取Node-RED的最新版本
查看>>
Node-RED中使用JSON数据建立web网站
查看>>
Node-RED中使用json节点解析JSON数据
查看>>
Node-RED中使用node-random节点来实现随机数在折线图中显示
查看>>
Node-RED中使用node-red-browser-utils节点实现选择Windows操作系统中的文件并实现图片预览
查看>>
Node-RED中使用node-red-contrib-image-output节点实现图片预览
查看>>
Node-RED中使用node-red-node-ui-iframe节点实现内嵌iframe访问其他网站的效果
查看>>
Node-RED中使用Notification元件显示警告讯息框(温度过高提示)
查看>>
Node-RED中使用range范围节点实现从一个范围对应至另一个范围
查看>>
Node-RED中实现HTML表单提交和获取提交的内容
查看>>
Node-RED中将CSV数据写入txt文件并从文件中读取解析数据
查看>>
Node-RED中建立TCP服务端和客户端
查看>>
Node-RED中建立Websocket客户端连接
查看>>
Node-RED中建立静态网页和动态网页内容
查看>>
Vue3+Element-ul学生管理系统(第二十二课)
查看>>